Happy 5th birthday to the FishSource Aquaculture (FS Aqua) profiles. March 2023 marked five years since the first 42 FS Aqua profiles were published, to assess whether aquaculture in a given province or state follows a zonal approach to aquaculture management. This initial batch has since been joined by 30 more profiles.
While 72 might not seem like a particularly large number, especially when compared to the thousands of wild-capture profiles available in FishSource, what the FS Aqua profiles lack in number, they make up for in coverage. These profiles now include the top producing regions for pangasius, salmon, shrimp, and tilapia worldwide, as well as major seabass and seabream producers.
Crucially, all of the profiles, along with their five principle scores, are subject to regular updates. In fact, the original batch of profiles have now undergone at least two updates since they were first published.
As we celebrate the fifth anniversary of the first profiles, it seemed like the ideal time and opportunity to investigate any positive (or negative) changes to their scores over their short lifetime. I am absolutely fascinated by trends, so I didn’t need any encouragement to do this!
But first, a quick reminder:
What is zonal management?
A zonal, or landscape, management approach seeks to minimize the cumulative impacts multiple farms have on natural resources and the shared risks these farms face. This approach forms the basis of SFP’s Framework for Sustainably Managed Aquaculture.
FS Aqua profiles take the five key principles of this framework (and hence zonal management) and translate them into five principle scores:
- Regulatory Framework
- Organized Producers Following Code of Good Practice
- Water Quality Management
- Disease Impact and Risk Reduction
- Marine Feed Ingredients.
The scores are determined based on how much information is available to the public, how well the industry in question is managed, how well the rules are enforced, and how well the industry is doing in regard to these five topics. Scores can range from < 6 to ≥6 to ≥8 to a perfect score of 10.

Sustainability is increasing
I am always on the lookout for positives, so I am happy to report that an analysis of current and historical FS Aqua scores revealed little evidence of any falling scores, although many of the principle scores did remain static. This was particularly noticeable across the tilapia and pangasius profiles, as well as for scores related to organized producers and water quality.
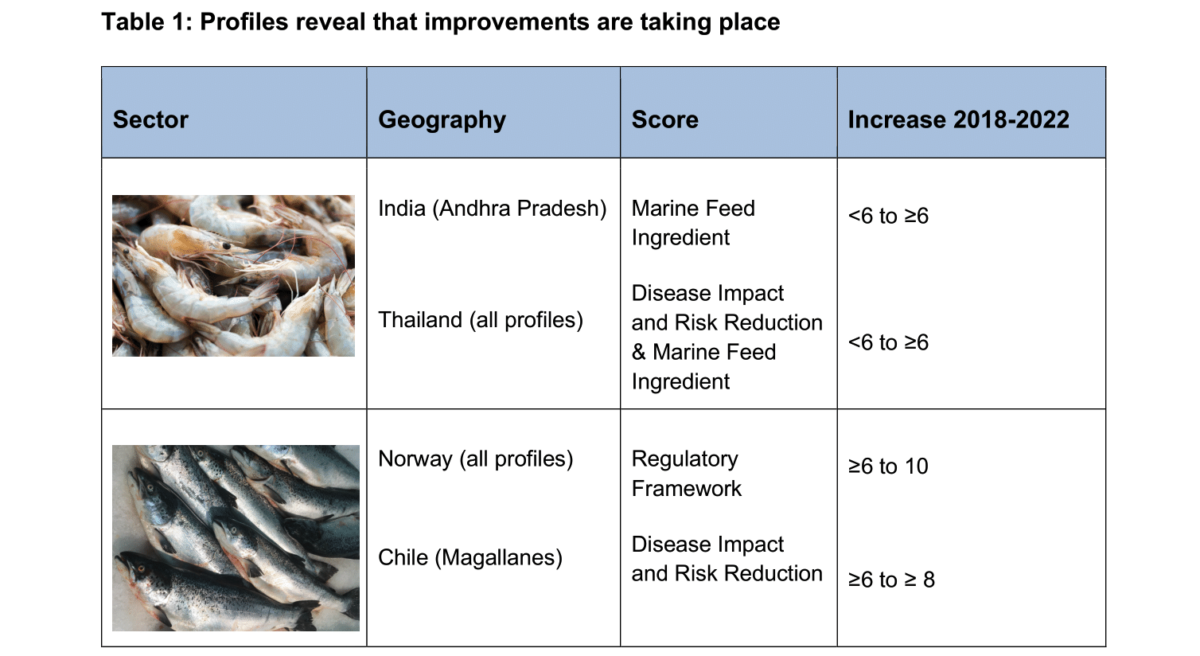
The more positive news is bright spots in progress and improvement, with increased scores across several salmon- and shrimp-producing geographies (Table 1).

Digging into the reasons for these increases reveals that they are due in part to improved information and data availability. High-quality quantitative data on these farming systems has often been unavailable or very difficult to find, with information buried within individual websites and reports. As an analyst, I have noticed a general and gradual increase in the information available in recent years. Tools to uncover and translate information are also improving, which makes it easier to find the information needed to complete the profiles.
The increase in scores can also be attributed to tangible improvements in aquaculture management introduced during the lifetime of the profiles. Examples of improvements captured during profile updates include:
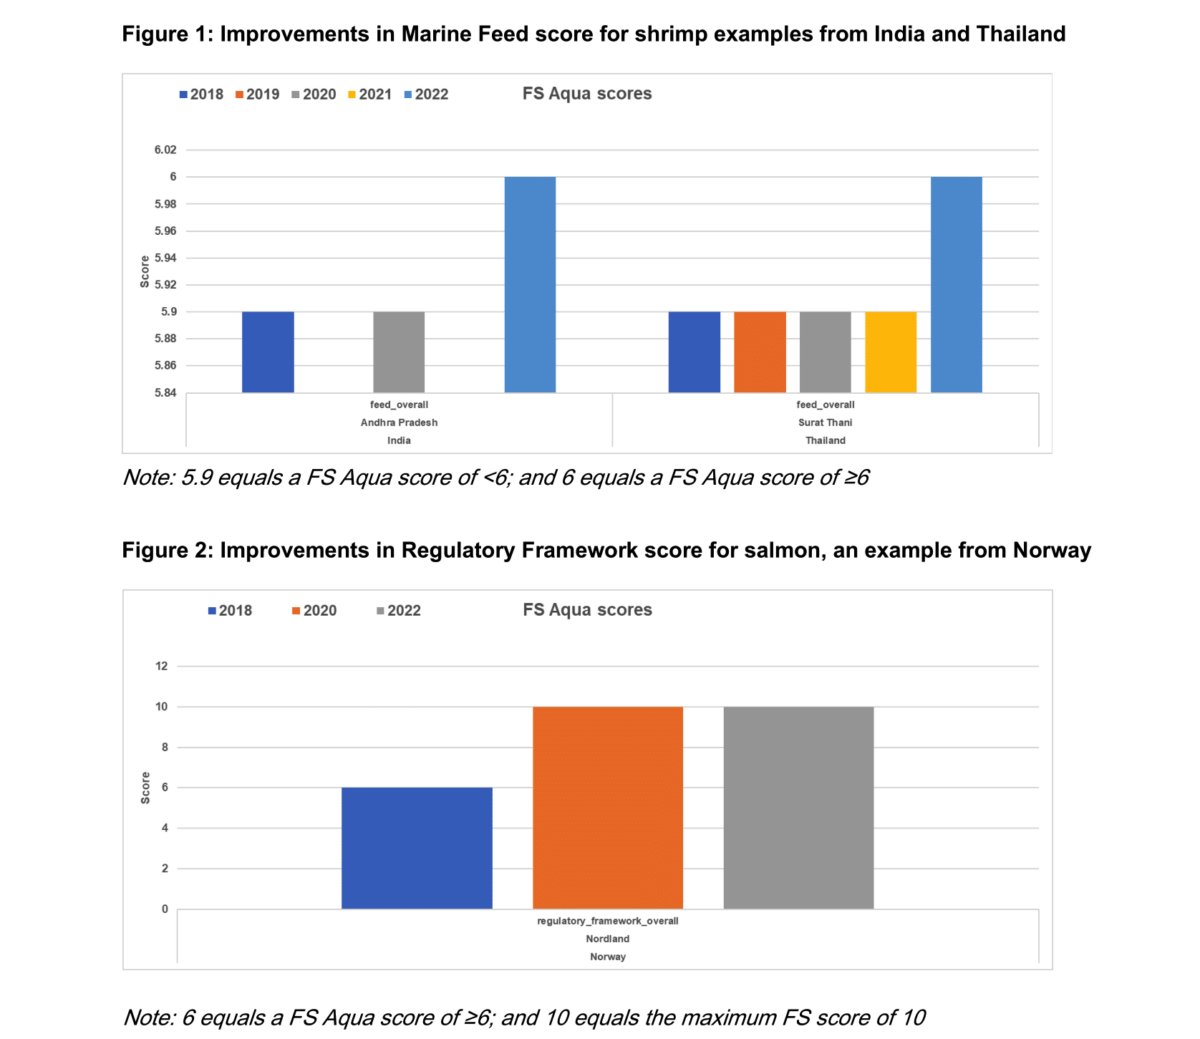
- Increases in the Marine Feed Ingredient score (Figure 1) witnessed across several shrimp profiles (India and Thailand), due to:
- Major feed suppliers in these geographies now being identified
- Major suppliers beginning to identify their sources of fishmeal and oil used in warm water feeds, as well as their commitments to improve the sourcing and sustainability of these sources.
- Improvements to disease reporting, including the publication of the results of disease testing, which led to a higher Disease Impact and Risk Reduction score across all of the Thai shrimp profiles.
- The introduction of production areas within the Norwegian salmon industry, which was responsible for an increased Regulatory Framework score across all of the associated profiles (Figure 2).

Another interesting finding is that the scores are often similar or identical across all provinces and states under an individual country and species. The results do show some degree of variation at the sub-national level, but often this is not enough to impact the overall principle score.
However, one prominent exception to this can be found in Magallanes in Chile. Here, diseases such as infectious salmon anemia and outbreaks of sea lice are far less prevalent than in other areas of the country, which has led to a higher Disease Impact and Risk Reduction score for this province.
The advantages of greater transparency through enhanced public information
Although it doesn’t always show in improved principle scores, all the profiles indicate that there has also been an overall improvement in the amount of publicly available information on which to base assessments, including that provided by international certification organizations. This indicates a positive trend toward more transparent industries worldwide.
Salmon-producing regions still lead the way due to their maturity and the structure of their industries, but other industries are following in their footsteps.
Some might say this increased transparency can be used as a tool to criticize the industry. To which I would say, they are correct. But I always counter this by adding that, even in these cases, greater transparency through public reporting provides confidence that the industry is being monitored, and that emerging issues can be identified and responded to quickly.
Why is this important?
You might be surprised to learn that there is no universal definition of sustainable aquaculture. But I prefer not to get bogged down in this sustainable aquaculture conundrum. The aquaculture industry hasn’t, nor have certifications and ratings schemes that monitor and assess management approaches or aquaculture’s environmental and social performance.
I believe that it is much more useful to visualize aquaculture sustainability as a journey, one where the destination is yet to be fully defined, but where advances and improvements are being made and where greater sustainability is being achieved.
These improvements can be measured – and this journey is being monitored by a host of organizations using a range of indicators at different geographic scales – as demonstrated perfectly by the Certification and Ratings collaboration and its data tool and, of course, annual analyses under SFP’s Target 75 initiative.
Looking to the future
The quantifiable improvements in FS Aqua scores provide additional evidence of improvements toward greater sustainability, and, like other assessments and ratings, also identify where further improvements are required. As we celebrate the fifth anniversary of the profiles, I look forward to capturing further improvements and trends in the future.
But, what will this future look like, and what will the 10th anniversary of the profiles bring?
I definitely predict further improvements: some fueled by collaborations in reduction fisheries that supply feed ingredients such as those under the Global Roundtable on Marine Ingredients; others fueled by the use of technologies and apps that let farmers collaborate in water quality and biosecurity, including through aquaculture improvement projects; and still others in traceability that allow consumers and analysts to trace products back to the farm source to make more informed purchasing decisions.
Looming large over this progress will be climate change and ways that an industry with a comparably lower carbon footprint can help mitigate against and adapt to the impacts of climate change and help ensure future food security.
As a positive person who is obsessed with trends, I believe there is a lot to look forward to.

